Those getting their feet wet in crypto, or trading in general, tend to get drawn by the allure of overnight riches. The investment craft is thus often compared to gambling, for good reasons.
The non-trading investors would advocate HODLing over a long time horizon, and to do so because of a genuine belief in the future prospects of a company or project. Even then, professional traders have methods to the market madness — they have a deep study of market patterns and rely on multiple technical indicators to make judgement calls.
Beginners and new converts of Bitcoin who wish to do more than HODL won't need to be glued to multiple monitor screens, but it would be wise to get a fundamental grasp of the following indicators instead of plunging headfirst without doing due diligence.
- The Moving Average:
- Relative Strength Index
- Trading Volume
- Whale Activity
Why Indicators Matter in Crypto Trading
Indicators serve as the compass in the tumultuous seas of crypto trading. They guide traders in making informed decisions by analysing historical data, current market conditions, and future trends. Without them, navigating the volatile and unpredictable crypto market can be akin to sailing blindly through a storm.
While no indicator guarantees success, they act as critical tools. They help identify potential entry and exit points, gauge market sentiment, and manage risks effectively.
In essence, indicators provide a data-driven framework that mitigates emotional decision-making like fear of missing out (FOMO) and fear, uncertainty, doubt (FUD).
Recap: Fear and Greed Index
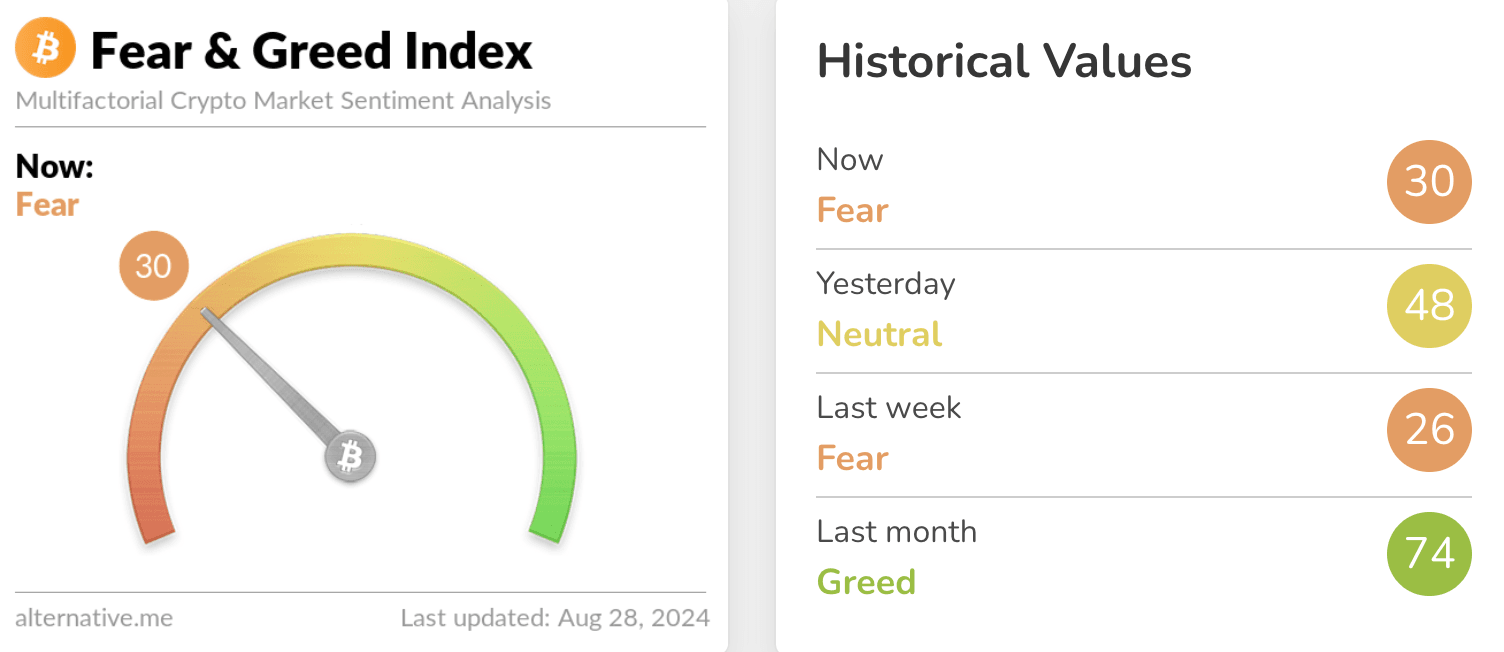
We last published a guide on how to use the Fear & Greed Index, arguably the most popular yet fundamental tool to gauge the Web3 crypto market.
To recap, it measures market sentiment on a scale of 0 to 100, where 0 represents extreme fear and 100 signifies extreme greed.
- Extreme Fear (0-25): This suggests investors are overly worried, potentially indicating a buying opportunity as prices might be undervalued
- Fear (25-50): While still cautious, the market sentiment is less pessimistic, hinting at a potential bottoming out
- Neutral (50): The market is balanced, with neither fear nor greed dominating
- Greed (50-75): Investors are becoming increasingly optimistic, potentially indicating a market top and a possible selling opportunity
- Extreme Greed (75-100): The market is euphoric, suggesting a potential bubble and a heightened risk of a sharp correction
While the Fear & Greed Index can provide valuable insights, it's important to use it in conjunction with other indicators and fundamental analysis.
1. The Moving Average: A Trend Tracking Ally
Moving averages (MAs) are the basis of technical analysis, providing Web3 traders with a visual representation of price trends over a specified period. By smoothing out price fluctuations, MAs help identify the underlying direction of the crypto market and potential shifts in momentum.
There are different types of moving averages, with the Simple Moving Average (SMA) and the Exponential Moving Average (EMA) being the most popular. The SMA calculates the average price over a certain number of periods, whereas the EMA gives more weight to recent prices, making it more responsive to new information.
But why is the moving average so vital? Because prices move in trends, and understanding these trends can provide critical insights into when to enter or exit crypto trades. For example, when the price crosses above a moving average, it typically signals a potential buy opportunity as the market may be entering an uptrend. Conversely, when the price falls below the moving average, it may indicate a sell signal.
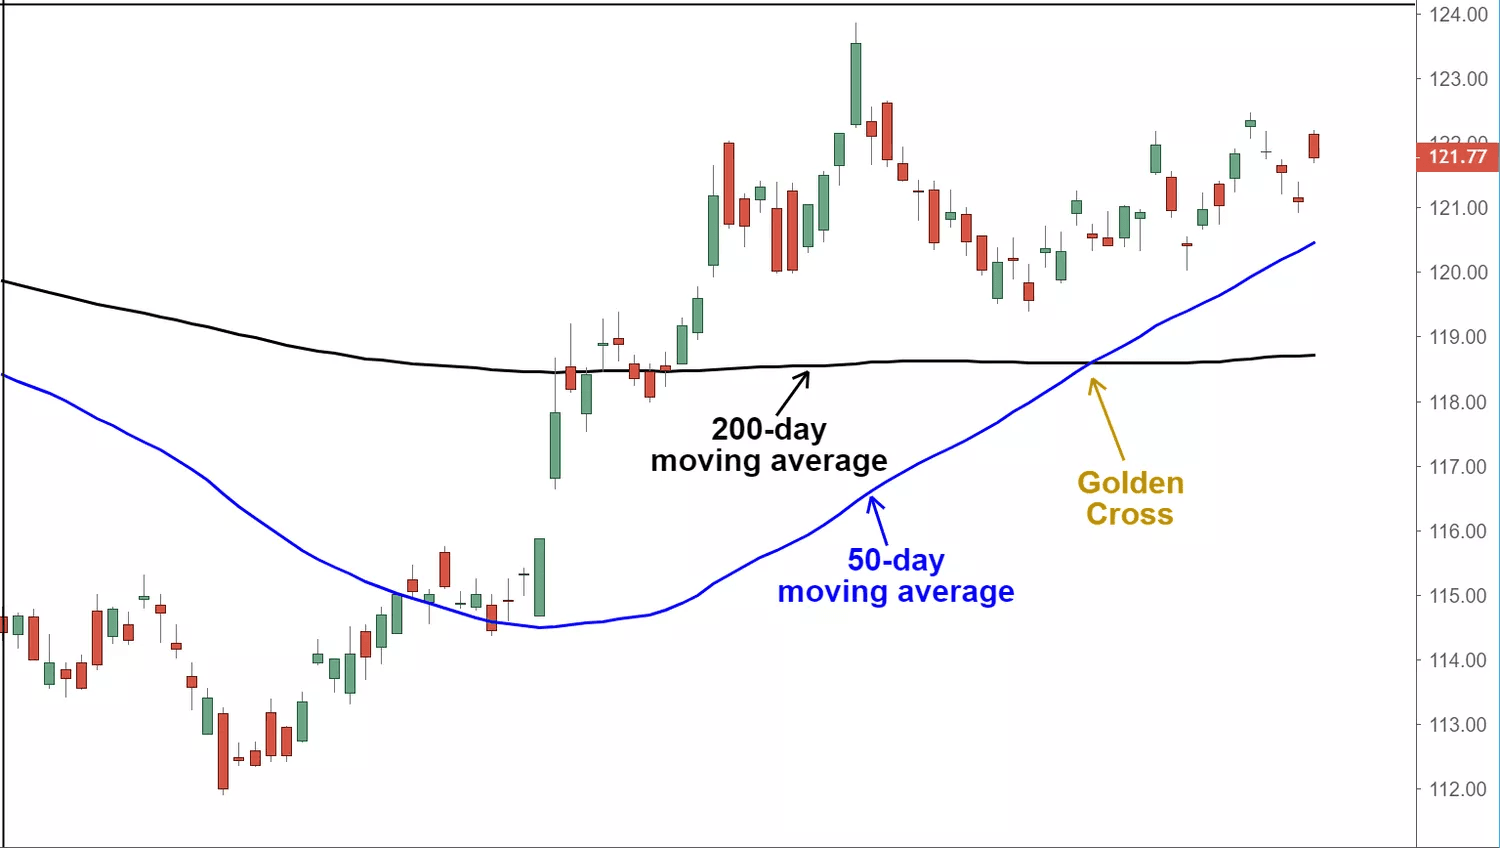
Two key moving averages widely used in both SMA and EMA are the 50-day and 200-day MAs.
- The 50-day MA: Reflects the average price over the past 50 days, offering insight into short-term trends.
- The 200-day MA: Represents the average price over the past 200 days, providing a broader perspective on long-term trends.
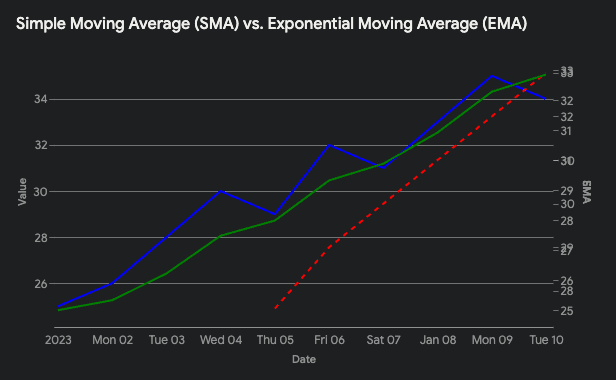
You can see how the EMA follows recent price fluctuations closely compared to the SMA, which provides a smoother trend line
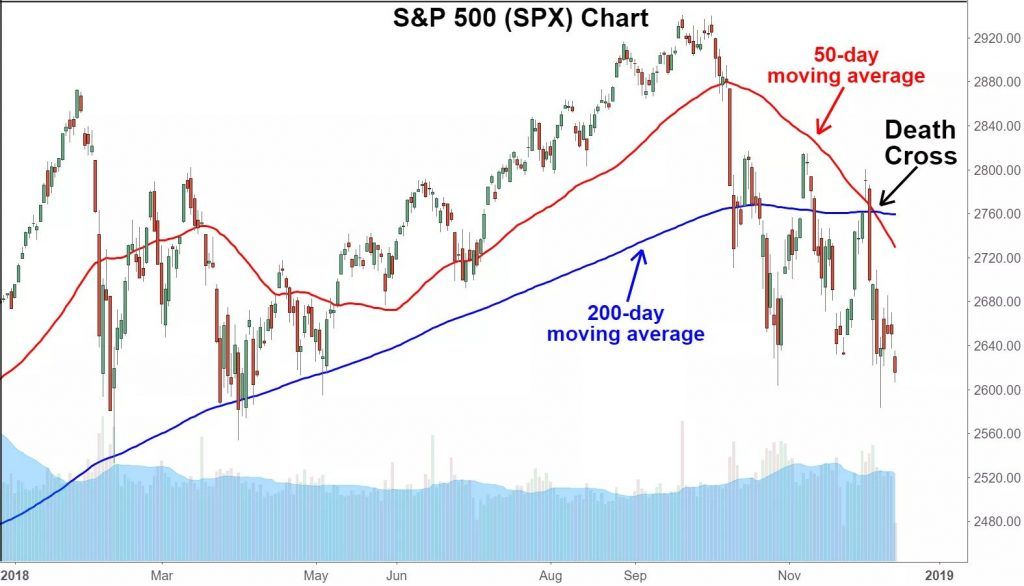
The interaction between these two MAs can generate powerful trading signals:
- Golden Cross: When the 50-day MA crosses above the 200-day MA, it is considered a bullish signal, suggesting a potential uptrend.
- Death Cross: Conversely, when the 50-day MA crosses below the 200-day MA, it is viewed as a bearish signal, hinting at a potential downtrend.
Traders often use these signals in conjunction with other indicators to confirm trend reversals and make informed decisions.
2. RSI: Spotting Market Momentum
The Relative Strength Index (RSI) is a momentum oscillator that measures the speed and change of price movements in the Web3 crypto market.
Created by J. Welles Wilder, it oscillates between 0 and 100 and is primarily used to identify overbought or oversold conditions.
How RSI Works
RSI is calculated using the formula:
RSI = 100 - (100 / (1 + RS))
where RS is the average of x days' up closes divided by the average of x days' down closes. The default setting for RSI is 14 days, but traders can adjust it based on their trading style and objectives.
Key Levels
RSI is typically used with key levels marked at 30 and 70. An RSI below 30 indicates that the asset may be oversold, suggesting that it could be undervalued and present a potential buying opportunity. Conversely, an RSI above 70 signals that the asset might be overbought, potentially providing a selling opportunity as the asset may be overvalued.
- Overbought (RSI > 70): The asset may be overvalued, indicating a potential reversal or pullback
- Oversold (RSI < 30): The asset may be undervalued, suggesting a potential upward reversal
- Mid-Range (30 < RSI < 70): The asset is neither overbought nor oversold, considered a more stable or neutral zone
Divergence
Divergence between the RSI and the price of the asset can also offer valuable trading signals. A bullish divergence occurs when the price makes a new low, but the RSI forms a higher low, suggesting that the downtrend might be losing momentum.
On the other hand, a bearish divergence happens when the price achieves a new high, but the RSI prints a lower high, indicating fading upward momentum.
Using RSI with Other Indicators
Traders often use RSI in combination with other indicators like Moving Averages to confirm signals and reduce the risk of false positives. For instance, if the RSI indicates an overbought condition and the moving average shows a potential downtrend, it might be a stronger signal to consider selling.
3. Trading Volume: A Sign of FOMO
Trading volume measures the number of assets traded over a given period and serves as a vital indicator for verifying the strength of a price movement. When a price change is accompanied by high trading volume, it often signals a genuine shift in market sentiment, making trends more reliable. Conversely, low volume can suggest that such moves may lack the conviction to sustain themselves.
Let's say you've been observing Bitcoin's price movement, and it spikes. Either one of the following could happen:
- The spike is paralleled by a surge in trading volume: It's a strong indication that many traders are jumping on the bandwagon, possibly driven by FOMO. High volumes can often lead to more volatile price movements, as new participants flood the market.
- The spike is contrasted by low trading volume: This should raise eyebrows. It might indicate a temporary and unsustainable move, or even the possibility of market manipulation, often involving few but powerful market participants.
Integrating trading volume into your analysis can help you distinguish between real, robust market trends and fleeting anomalies. Additionally, coupling it with other indicators like the Moving Average or RSI can provide you with a well-rounded perspective, allowing you to make more informed trading decisions.
4. Whale Activity: When in Doubt, Follow the Big Fish
Crypto whales, entities holding vast amounts of a particular cryptocurrency, wield significant influence over the market. Their large transactions can trigger price swings, indicating potential trends or reversals.
- Sudden large buys (accumulation): This often suggests that whales anticipate a price rise, signaling a potential bullish trend. Smaller traders might interpret this as an opportunity to buy in anticipation of the price increase.
- Sudden large sells (distribution): This might indicate whales believe a price drop is imminent, possibly signaling a bearish trend. This could serve as a warning for smaller traders to consider selling or taking profits.
- Consistent accumulation over time: This might signal longer-term confidence in a particular cryptocurrency, potentially hinting at an upcoming bull run
- Movement of large holdings between wallets/exchanges: This could be an indication of upcoming market activity. If whales move coins onto exchanges, they could be preparing to sell, while moving coins off exchanges might suggest a holding strategy.
Tools for Tracking Whale Activity:
- Blockchain explorers: These allow you to track large transactions and identify potential whale wallets.
- Onchain search engines: An example is DexCheck AI, an aelf partner. It lets users enter prompts to search for any onchain information, including whale movements.
- Whale alert services: These provide real-time notifications of large cryptocurrency transactions.
- Social media and news: Stay updated on news and discussions related to whale activity.

While the indicators discussed so far offer valuable insights, manually tracking and interpreting them can be time-consuming and prone to human error. Thankfully, advancements in artificial intelligence (AI) and blockchain technology can automate the process in one fell swoop.
An emerging technology arising from this powerful combination are AI trading bots, which we have written about. You can get the details on how they help take the tedium out of trading activities in there.
aelf, a layer 1 AI blockchain infrastructure, had since embraced AI technologies to further enhance its already high-performance, scalable network. It comprises a mainchain with sidechains structure, parallel processing, and cross-chain interoperability to stretch the possibilities of AI dApps that could be built on the ecosystem, not excluding automation tools within the DeFi and trading fields.
In Closing
By leveraging these top four indicators — Moving Averages, RSI, Trading Volume, and Whale Activity — beginners can be less gambler, and more savvy-trader. Each indicator provides unique insights into market trends, momentum, and behavior.
Because none of these indicators work flawlessly in isolation, the key lies in combining them to paint a comprehensive picture of market conditions. This promises to help navigate the volatile waters of crypto, be it in times of fear or greed.
*Disclaimer: The information provided on this blog does not constitute investment advice, financial advice, trading advice, or any other form of professional advice. Aelf makes no guarantees or warranties about the accuracy, completeness, or timeliness of the information on this blog. You should not make any investment decisions based solely on the information provided on this blog. You should always consult with a qualified financial or legal advisor before making any investment decisions.
About aelf
aelf, an AI-enhanced Layer 1 blockchain network, leverages the robust C# programming language for efficiency and scalability across its sophisticated multi-layered architecture. Founded in 2017 with its global hub in Singapore, aelf is a pioneer in the industry, leading Asia in evolving blockchain with state-of-the-art AI integration to ensure an efficient, low-cost, and highly secure platform that is both developer and end-user friendly. Aligned with its progressive vision, aelf is committed to fostering innovation within its ecosystem and advancing Web3 and AI technology adoption.
For more information about aelf, please refer to our Whitepaper V2.0.
Stay connected with our community:
Website | X | Telegram | Discord